Have you ever wondered how productive your operation is?
Do you want to know how efficient it is?
Do you think about how much your business might be worth?
You’re not alone.
We have people from all across the country that ask us these questions every day.
So, in response to these questions, we have developed a method for answering these questions.
We are in the unique position that we have visibility into all different types of
operations, big and small, rural, urban and yes, even linehaul. Not only can we see into these operations from a data standpoint, but as most of you know, we talk to many of you each day.
It is from our data, our over 70 years of experience, and from sharing best practices with all of you that we have crafted a very comprehensive report that gives you the answers to these burning questions.
How Do We Build The Report?
If you are an eTruckBiz client, you already know about all the data we gather from your operation. This data is used to build extremely useful information that is vital to your business.
An example of this is taking your driver’s on duty time and subtracting the on road time to give you the “in building time”. Those times are collected from your drivers for DOT hours of service purposes, but it can also be used to see who you have that  may be spending too much time in the building. As you know, driver’s time is best spent on-road, performing revenue generating activities like doing pickups and deliveries.
As far as the Productivity, Efficiency and Opinion of Value Report, we use the data we already have, and some fancy math, for the basis of this analysis. Then, we look at it again, based on our years of experience, to come up with the final numbers.
We can then tell a lot from the report. We can even uncover some basic problems based on the data, like not reporting hours of service correctly.
We are also able to tap our database to get averages and other information that will be useful when comparing your operation, with others that are similar in size and operating characteristics.
We believe we have the best set of data, outside of FXG, to utilize to come up with a very objective look at your business.
What Does It Tell Us?
The analysis gives you a comprehensive look at your business, in a way that is not readily available to you with the limited data set that you have.
We focus on four major areas.
1) Driver Productivity
First, there is a deep look at how productive your drivers are.
We take a look at your On-Road hours per driver, and then, the all-important Stops Per On Road Hour.
This metric (SPORH), is the single most critical metric that you should be monitoring as a P&D service provider. Everything that you do, should be somehow geared toward improving this number.
Always. Everyday. Every Hour.
If you will take a look at your sister company, FedEx Express, and your competitor, UPS, their entire engineering and management effort is focused squarely on this number. We think you should be doing the same thing.
Now we know that when folks get the "package-blinders" on, following this, or any other, metric becomes difficult. The reality is, if you are not monitoring this number, you will never achieve anything beyond “just getting by”. The implications of managing this number are so great, that we have even provided some new data collection and reporting functionality embedded in the new driver app that will allow you to monitor this on a daily basis.
 Along with the above metric, the analysis will show you how your productivity numbers stack up to other, similar size and mileage operations, by comparing your results with these averages.
Of note here is that we don’t want you to become too happy with being “average”. Because of the characteristics of your businesses, FXG contractors lag other companies like FedEx Express and UPS. The difference is often 5,10 or more stops per on-road hour. FXG contractors do not have the density the others have, but that does not mean that you should accept the SPORH gap as something you can’t do anything about.
The gap exists more because the metric is rarely, if ever, scrutinized. It is not something that most contractors even think about, let alone, measure every day.
2) Operational Efficiency
The second part of the analysis concerns how efficient your operation is as compared to what it could be.
We look at how many stops are performed on a daily basis. We also look at how many on-road hours it takes to do those stops.
If we find that some, or all your drivers are “on-road” less than 9 hours per day, we will calculate how many more stops they could be doing if they were. We call these “opportunity stops”. The industry standard for a delivery driver is 9 hours, on road, per day. That means there is a 9 hour window in which to perform stops. Anything less than this results in under-utilization of all of your company assets, like trucks. Not just the driver's on road time.
We then calculate what we call “the power of one”. This is the total number of stops that could be performed by your business if everyone was able to perform one more stop per hour. Included in this calculation is regression analysis for additional miles driven and package handling.
 This is definitely an eye-opening calculation! We know that just about everyone involved would admit to the ability to get one more stop completed an hour. Area knowledge, P&D methods, and route planning are big factors in helping a driver attain an extra stop per hour.
The next calculation is the eTruckBiz efficiency rating. It is a measure of how many stops are being performed compared to how many should be being performed based on opportunity and power of 1 stops. It is a percentage of capacity that is being utilized.
The next number that we come up with is what we call your eTruckBiz efficiency score. This score is determined by assigning a range of values between 2 and 5. A 2 would signify an operation that is vastly underutilized and inefficient, and a 5 is an example of an operation that is humming along at maximum efficiency.
Not surprisingly, this number looks a lot like the multiples that are used in determining the market value of a business like yours. More on this later.
3) Operating Ratio
The transportation industry uses something called an Operating Ratio to determine the profitability of an operation.
Your operating ratio is determined by dividing your net operating expenses by your gross revenue.
For example, if you have $100,000 of revenue, and $90,000 of expenses, you would divide $100,000/$90,000 = .90 or a 90 operating ratio.
A good way to remember what this means is that in this case, it is costing you .90 cents for every dollar of revenue you produce.
If you are a Bookkeeping subscriber to eTruckBiz, we will know what your expenses are, and as part of your base subscription, we will have already have your settlements. Using these numbers, we can come up with a very accurate operating ratio for you.
If we don’t have your expenses, you can ask your accountant for a recent P&L so we can get your expense information. We will use it to get the numbers needed for you calculation.
 If you don’t have this, or, maybe you are buying someone else’s business, we can use some very accurate averages that we have from our vast database.
Once we have calculated an operating ratio for you, we can do some other things with it. We can show you what the impact of increasing your productivity and efficiency will have on the profitability and value of your business. We can calculate what would happen if you were able to implement the "power of 1" and what it would mean to your bottom line.
You would be shocked at the results!
4) Opinion Of Value
Not only can increased productivity and efficiency have a tremendous impact on your operating results (profit), but it can significantly increase your business’s value as well.
How you ask?
Well, first, we need to understand that FXG is not in the business of paying contractors differently, when it comes to the net amount they expect to pay you on a per unit basis.
 Saying this another way, they want to pay everybody the same thing per stop and package, after making considerations for what they have determined your costs should be.
So, they do pay everybody something different, but it’s because every work area has different cost characteristics that apply to their areas. If you operate far from a terminal, your stem miles are accounted for in the form of a core zone payment. In the ISP world, you actually will negotiate these differences, in the form of higher stop and package rates with FXG.
But in the end, FXG wants you all to come out the same as far as your operating net income. They have to. It’s how they can price their product to their customers, knowing they can control their costs in this fashion.
So, if we have a common understanding about how FXG engineers their settlements, we can then make the assumption that contracting businesses should be measured by their ability to realize the most profit from what are standard cash flows.
The more productive and efficient an operation is, the lower the costs are, which results in greater operating income and profit. Operations that are able to manage greater profits from the standardized cash flows are more valuable and therefore worth more on the market.
The more productive efficient your operation is, the more it is worth.
This is what we base our opinion of value on.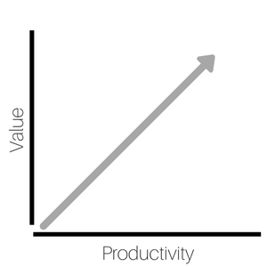
We take your gross revenue, multiply it by 1-your operating ratio. This gives us your estimated operating income. We then take your estimated operating income and multiply it by your eTruckBiz efficiency score, which gives us our opinion of value of your business.
We then do the same thing, but this time use the operating ratio which was calculated for your “power of 1”. It’s here that you can see a dramatic difference of operating a business more productively and more efficient.
Why Should I Have You Do This For Me?
This is an analysis that should be done for many reasons.
First, if you are considering putting your business up for sale, you’d want to get an idea of what it might be worth out there in the market. We can also coach you into increasing your business’s value by showing you how to make it more profitable through increased productivity and efficiency.
If you are a purchaser, we can evaluate what we think an operation is worth.
It is important to note here that we have the only objective way to apply a mass valuation formula across all FXG contractors. It is though our large database that we can objectively apply this valuation logic.
We have found that our methodology for determining productivity, efficiency and an estimated operating ratio is very solid. In the case where someone wants to ask for or offer varying sales prices, it is the industry multiple that needs to be negotiated between the parties. This is where you can account for management experience, new equipment, etc.
So those are a couple of cases where you’d want to use this analysis, but the most critical utilization of this analysis is when you are trying to simply increase the profitability of your business.
You must understand WHY your results are what they are. You must also understand that based on the nature of your business, there is no “silver bullet” that can replace productivity and efficiency. The only way to improve these numbers is to first calculate and monitor them.
It is only by keeping score that you can win the game.
When Should I Get This Done?
We suggest, if you are really serious about improving your operation's productivity, to have this done at least once per quarter.
There are ways to monitor daily, and weekly productivity, like your Stops Per On-Road Hour through the eTruckbiz system, but you’ll want to see how you are progressing on your company’s value as well.
 This is the only way to understand what really effects your operating results.
It’s the only way to get the package blinders off, and really expose what’s at the heart of what makes your company tick.
We know you have people problems, maintenance problems, and management problems. Everybody does. These problems are at the root cause of your less than optimal productivity.
It’s only when you look at your productivity and efficiency issues that you will be able to run as profitable of an operation as FXG intends you to. By moving the productivity needle, you’ll make your business worth more as well.
I'd like to know what you think about this.
Please leave your comments below.
Thank You!
Carey Manders
Director Of Client Financial Services
Carey@etruckbiz.com
